IN Brief:
- Europe installed 8.8GW of wind capacity in H1 2026, including 7.1GW within the EU.
- Onshore projects accounted for 6.5GW, while 2.3GW of offshore capacity was connected.
- WindEurope forecasts 148GW of European additions over 2026–2030, although permitting has weakened in several major markets.
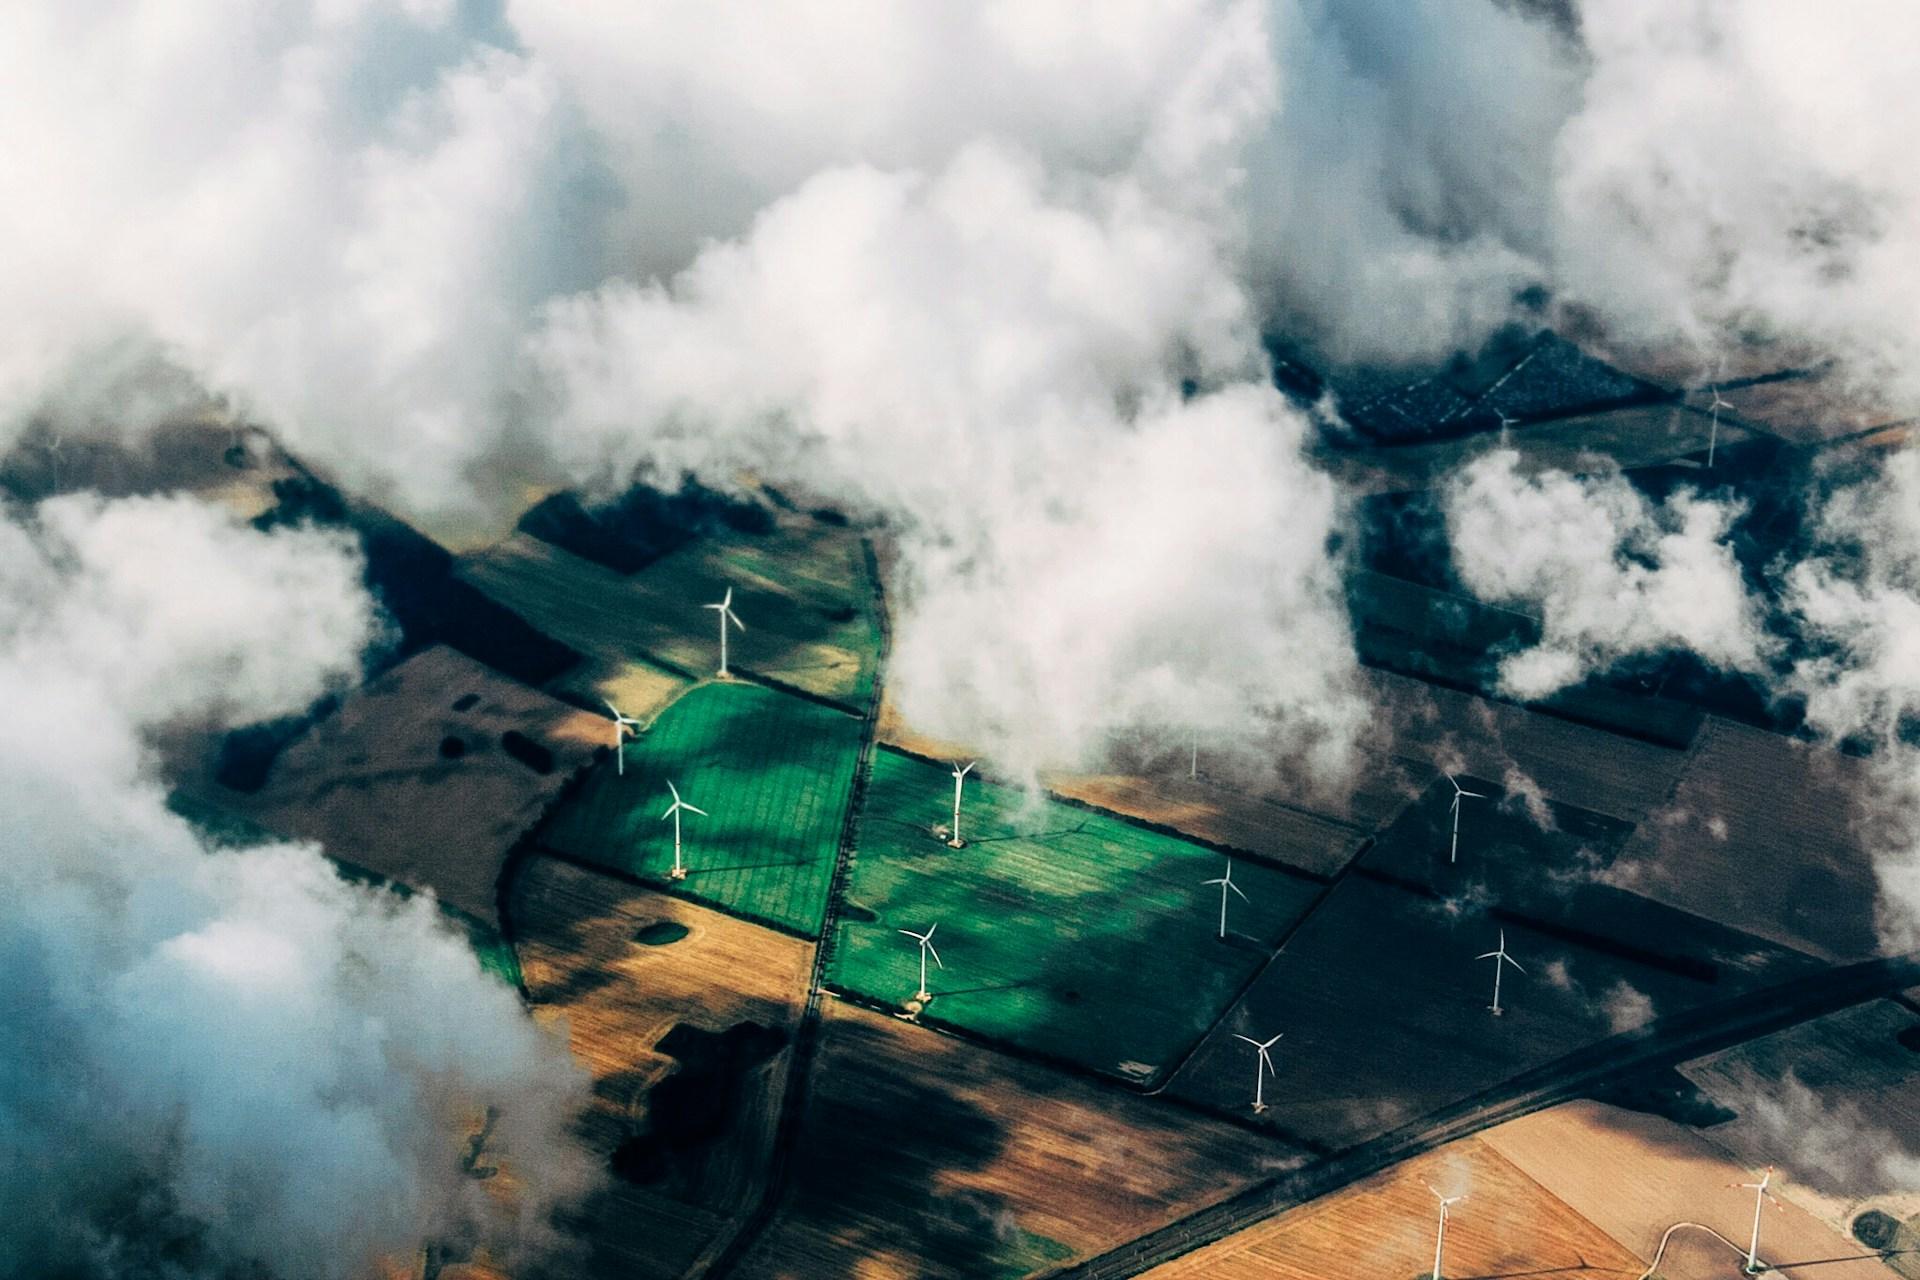
WindEurope says Europe installed 8.8GW of new wind generation during the first half of 2026, a 30% increase on the equivalent period last year and enough to put annual installations on course for a new high.
The EU-27 accounted for 7.1GW of the additional capacity. Onshore wind represented 74% of installations, or 6.5GW, while 2.3GW of offshore capacity was connected to European electricity networks.
Germany recorded the largest increase at 3.4GW, followed by the UK with 789MW and Spain with 612MW. Total European wind capacity now exceeds 311GW, comprising 270.5GW onshore and 40.9GW offshore.
Within the EU, installed capacity is approaching 252GW, including 228.4GW onshore and 23.2GW offshore. WindEurope expects Europe to add 148GW between 2026 and 2030, including the capacity installed during the first half of this year, which would take the continental total to 436GW.
The association expects 111GW of those additions to be built within the EU, averaging around 22GW a year and lifting EU installed capacity to approximately 342GW by 2030. Its latest estimate for the whole of 2026 is 24GW of new European wind capacity.
Pipeline indicators are less uniform
The installation figures record projects that have already passed through development, financing, manufacturing, construction, and grid connection. Indicators for the next group of projects are more mixed, particularly where permitting and equipment orders are concerned.
Five European countries awarded support to 17.2GW of wind capacity during the first half, divided between 8.8GW onshore and 8.4GW offshore. WindEurope’s accompanying policy analysis puts planned second-half auction volumes at approximately 26GW.
Financing reached €9 billion for projects representing around 5.2GW of future capacity. Turbine orders totalled 10.6GW, including 7.8GW of onshore machines and 2.8GW offshore, but that order volume was 12% below the first half of 2025.
The difference between completed installations and orders is important because wind construction data inherently trails development decisions. Turbines connected in 2026 typically reflect investment and permitting work undertaken several years earlier, while weaker orders or approvals may only become visible in commissioning statistics later in the decade.
Germany provides the clearest example of the opposite effect. More than 9GW of new onshore wind capacity received permits during the first six months of 2026, giving developers a substantially larger pool of consented projects from which future construction orders can emerge.
Elsewhere, WindEurope recorded lower permitting volumes in Spain, France, the UK, Italy, and Ireland. If that weakness persists, it could constrain the number of projects available to reach financial close, order turbines, secure construction capacity, and eventually connect to electricity networks.
Grid readiness is another part of the delivery sequence. Wind projects can clear planning and procurement while still facing constraints around substations, transmission reinforcement, connection queues, and cable capacity, particularly where large volumes of generation are concentrated in the same region.
The issue is particularly visible offshore. Europe connected 2.3GW of new offshore wind capacity during the first half, across nine wind farms, while almost 24GW of additional offshore capacity is either under construction or expected to start construction within the next two years.
Each of those schemes brings a parallel electrical infrastructure requirement. Export cables, offshore substations, onshore converter or transformation equipment, protection and control systems, and wider transmission reinforcement have to arrive on a compatible programme if generating assets are to operate without prolonged connection delays.
The 30% year-on-year rise in installations therefore measures only one part of the sector’s workload. Manufacturing demand also depends on the geography and timing of turbine orders, while grid contractors and equipment suppliers have to respond to connection programmes that do not always follow the same timetable as the wind farms themselves.
Germany’s share of first-half installations illustrates that concentration. Its 3.4GW accounted for a substantial proportion of the European total, increasing demand in one market for turbines, towers, foundations, cabling, substations, and construction resources at the same time as permitting volumes are expanding.
A recovery in approvals across other large markets would broaden that construction pipeline, but it would also increase competition for manufacturing slots and specialist grid capacity. The issue for the remainder of the decade is therefore not simply how many gigawatts governments intend to procure, but whether consented projects, turbines, finance, network infrastructure, and contractors can reach site in the right sequence.
WindEurope’s latest forecast points to 436GW of installed European wind capacity by 2030. Whether the market reaches that level will be determined increasingly by the pipeline behind this year’s installations — particularly permitting, equipment orders, and the networks required to connect the next tranche of generation.