IN Brief:
- Fully operational floating offshore wind capacity has increased from 277MW to 382MW over the past year.
- A record 109MW has entered operation during 2026, taking Norway, France, the UK, and China to the largest operating fleets.
- RenewableUK tracks 152GW across 300 floating wind projects worldwide, although much of that capacity remains at development stages.
Operational floating offshore wind capacity has increased by 38% over the past 12 months, reaching 382MW worldwide as projects in Europe and Asia have moved from construction and commissioning into full operation.
RenewableUK recorded 277MW of operating capacity a year ago. Its latest EnergyPulse assessment shows 109MW has entered full operation during 2026, making this the strongest calendar year for deployment so far and narrowly exceeding the previous annual record of 108MW set in 2023.
Norway currently has the largest operating fleet at 97MW, followed by France with 87MW, the UK with 78MW, and China with 72MW. The 2026 additions include two French projects totalling 30MW and one 17MW project in Japan.
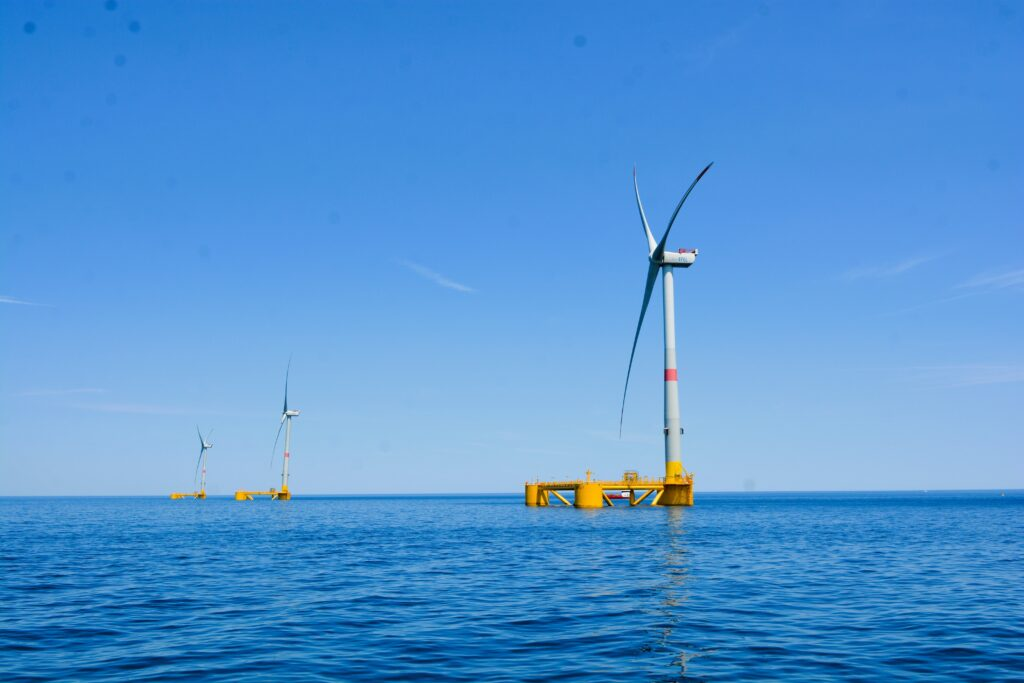
Those figures remain small beside offshore wind using foundations fixed to the seabed. Floating technology is intended for deeper water and other locations where monopiles or jackets become less practical, placing the turbine on a buoyant structure restrained by mooring lines rather than on a foundation rigidly attached to the seabed.
Movement therefore becomes part of the design. Wind, waves, and currents produce pitch, roll, heave, surge, sway, and yaw, while the rotor applies aerodynamic loads above the waterline. Foundation geometry, ballast, turbine controls, mooring stiffness, anchors, and the electrical cable have to be engineered around the resulting motions.
Extreme storms and routine operation create different structural demands. The platform and moorings must survive the largest expected environmental loads, but smaller movements repeated over many years can also produce fatigue. Components therefore need sufficient ultimate strength and sufficient fatigue life for the operating conditions expected at the site.
Dynamic electrical cables face the same repeated movement. The cable descends from the floating structure towards the seabed before connecting with the rest of the array network, so it must carry electrical current while tolerating bending and tension cycles. Platform motion, cable configuration, buoyancy elements, and seabed touchdown behaviour all influence the mechanical duty.
More operating projects provide data that design models alone cannot supply. Developers can compare predicted and measured platform motion, turbine availability, mooring loads, cable behaviour, corrosion, access requirements, and maintenance performance. That evidence becomes more important as projects move from a few demonstration turbines towards arrays containing dozens of machines.
RenewableUK tracks a much larger global development pipeline of 152GW across 300 active projects in 26 countries. The database covers projects from early development through to operation, so the 152GW figure is not a forecast of capacity that will necessarily be built. It describes the scale of the current project pipeline at different stages of maturity.
That distinction is substantial. Floating wind projects still need seabed rights, planning approvals, grid connections, revenue arrangements, engineering, supply capacity, finance, and final investment decisions before construction becomes certain. Capacity can remain in development databases for years, and some projects will change scale or fail to reach construction.
The UK demonstrates the gap between operating assets and the wider pipeline. Kincardine and Hywind Scotland provide 78MW of operating floating capacity, while RenewableUK tracks 28.4GW of UK projects. A total of 592.5MW has secured Contracts for Difference, 832MW across five projects is eligible for Allocation Round 8, nearly 14GW is moving through the Scottish offshore planning system, and 4.5GW has been leased in the Celtic Sea.
Moving even part of that pipeline into construction would change the manufacturing problem. Demonstration projects can use bespoke fabrication and installation methods for a handful of units, whereas commercial arrays require repeated production of floating foundations, mooring systems, anchors, and cable equipment at predictable rates.
Ports become part of the production system because many floating designs allow turbines to be integrated with their foundations alongside a quay before the complete unit is towed offshore. That approach can reduce some offshore lifting work, but it demands adequate water depth, quay strength, assembly space, storage, tow routes, and areas where completed units can wait before installation.
Mooring requirements scale with turbine numbers. Every floating turbine needs several lines and anchors, and larger rotors increase the structural loads entering the platform. Developers are therefore trying to control mooring loads and component size while maintaining adequate station keeping and redundancy over decades of operation.
Foundation technology is not yet standardised around one architecture. Semi-submersible, spar, barge, and tension leg concepts use different relationships between buoyancy, ballast, draft, mooring, and structural stiffness. Steel and concrete production routes create further differences in fabrication, port demand, transport, and repair.
The rise from 277MW to 382MW is therefore most useful as evidence that more floating systems are accumulating operating hours at sea. The 152GW pipeline shows the scale of developer interest, but conversion of that pipeline will depend on whether projects can turn operating experience into repeatable engineering, manufacturing, port, grid, and financing arrangements at commercial scale.